

Documentation
Mermaid Diagrams for JiraBrowse
Documentation
Mermaid Diagrams for JiraUsage and Search
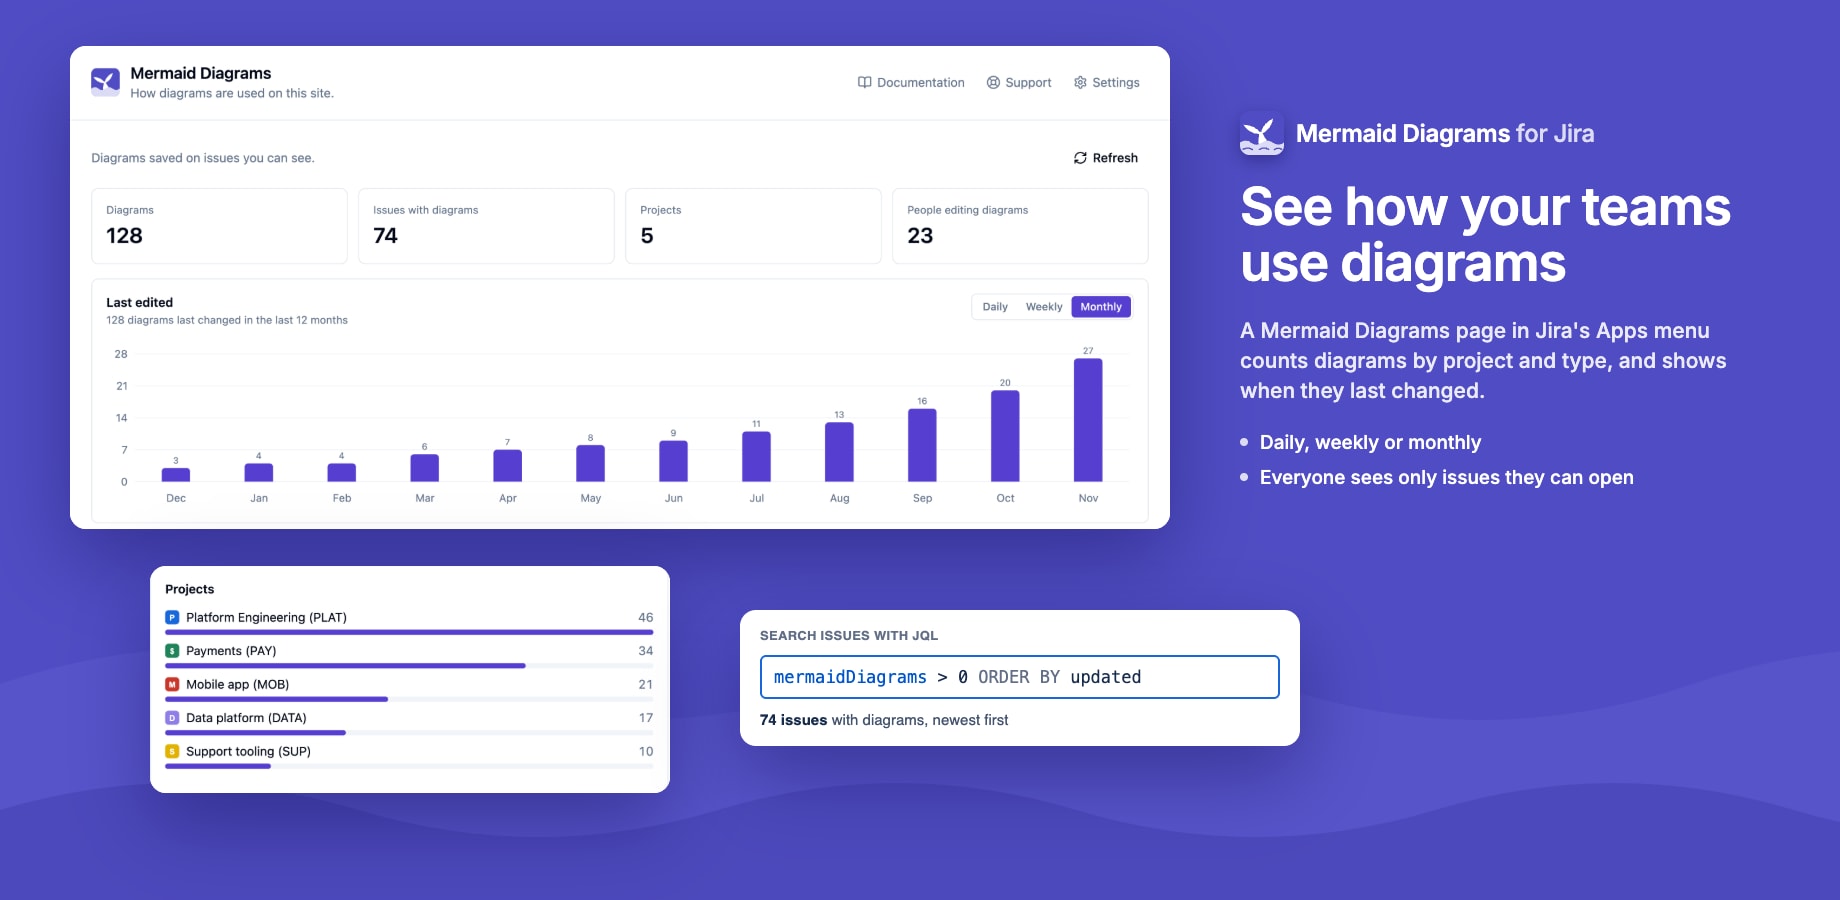
Open Apps in Jira's sidebar and choose Mermaid Diagrams to see how diagrams are used on your site.
What the page shows
| Section | What it shows |
|---|---|
| Totals | Diagrams, issues with diagrams, projects, and how many people edit diagrams |
| Last edited | Diagrams by when they last changed. Switch between Daily (the last 30 days), Weekly (12 weeks) and Monthly (12 months) |
| Projects | The projects with the most diagrams |
| Diagram types | Flowcharts, sequence diagrams, state diagrams and the rest |
| Recently updated | The issues whose diagrams changed last. Click an issue key to open it |
The page counts diagrams saved with the app. Mermaid code blocks in descriptions and comments aren't counted.
Everyone can open the page, and each person sees only the issues they're allowed to browse. People are counted, not named.
On sites with more than 1,000 issues with diagrams, the page reads the 1,000 most recently updated and says so.
Links
The top of the page links to this documentation, to support and, for Jira admins, to the app's settings (colour themes).
Find issues with diagrams in JQL
The number of diagrams on an issue is searchable. In Jira's issue search, switch to JQL and use:
mermaidDiagrams > 0
Combine it with anything else, for example project = PLAT AND mermaidDiagrams > 0 ORDER BY updated DESC. mermaidDiagramsUpdated is the date a diagram on the issue last changed.
If an issue whose diagrams were saved before version 2.8 is missing from the page or from a search, save one of its diagrams again.
Stuck on something this page does not cover? Ask the developers.